
Most Kafka performance problems start in the client applications. A producer sends every record in its own request, a consumer group has too few members, or a service opens a new connection for each message. The broker pays the cost in each case, but the fix is a client setting in somebody else’s code.
The platform team usually can’t see those applications. They see the brokers. Even without the client’s own metrics, the broker can tell you a lot about how each client behaves. This post goes through the AxonOps dashboards and panels that show where a producer or consumer needs tuning, and which settings to look at.
What the broker can and can’t see
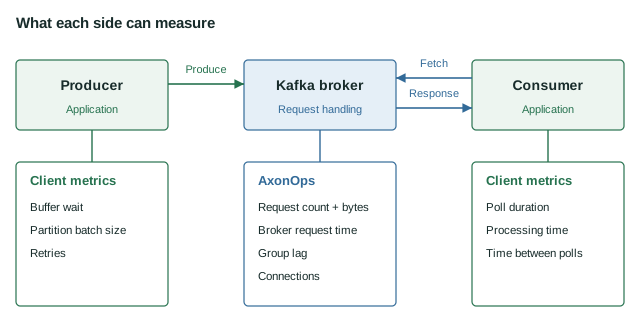
The broker sees every request a client sends: how many, how large, how long they take to serve, and which topics they touch. It knows each consumer group’s members, assignments and committed offsets. It sees every connection opening and closing, and the name and version of the client library that opened it.
It can’t see inside the client. Time records spend waiting in the producer’s buffer, the average batch size per partition, how long a consumer spends processing each poll: those only exist as client metrics. So broker metrics show that a client is badly tuned and point you at the likely setting. The client’s own metrics can then confirm it. The application performance guide covers which client metrics to check and how to tune the settings behind them.
Producers
Are producers batching?
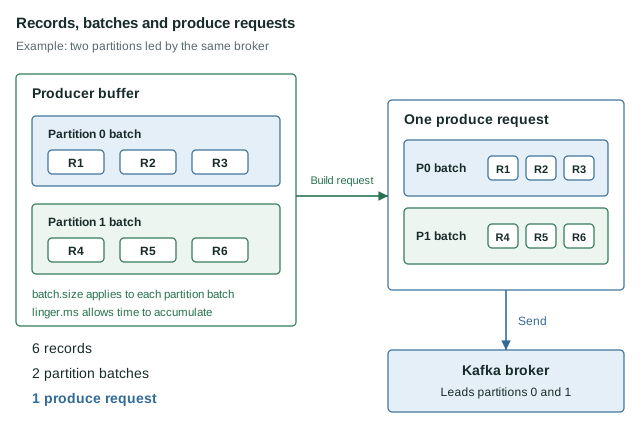
Batching is the biggest lever on producer efficiency. A producer groups records for the same partition into a batch and sends batches together in one produce request. Larger batches mean fewer requests, better compression and less work for the broker. Two settings control it: linger.ms, how long the producer waits for a batch to fill, and batch.size, the most it will put in one batch.
AxonOps shows both sides of the ratio you need:
- Kafka Requests dashboard → Produce Request Per Sec, per broker, and Produce request per sec per topic.
- Kafka Performance dashboard → Messages In Per Broker and Bytes In Per Broker. The Kafka Topics dashboard has Messages In Per Topic and Bytes In Per Topic for the same figures by topic.
Divide messages in by produce requests to get the average number of records per produce request. Divide bytes in by produce requests to get the average request size. Work it out per broker to see the overall picture, then per topic to find which topics are responsible.
The two tell you different things:
- Records per request close to 1 means producers are sending records almost one at a time. Look at
linger.msfirst. A few milliseconds of linger usually increases batch sizes a lot for a small increase in latency. - Request size far below
batch.sizemeans batches go out long before they fill. That’s normal for low-volume topics. On a busy topic it means linger is too short, or records are spread across so many partitions that no single partition’s batch has time to fill. - Request size close to
batch.sizeon a busy topic means batches fill before the linger time runs out. Raisingbatch.sizecan help there.
A produce request can carry batches for several partitions, so records per request is an upper bound on batch size. If it’s low, batches are definitely small. Bytes in are counted as they arrive, after compression. Small batches compress poorly, so if turning compression on barely shrinks the average request size, the batches are too small.
The batching and compression guides explain how the producer builds batches. The producer configuration reference covers the settings involved.
What small batches cost the broker
Many small requests cost the broker more than a few large ones, and the Kafka Performance dashboard shows it:
- Request Handler Avg Idle Percent falls as request threads spend their time on per-request overhead.
- Network Processor Avg Idle Percent falls the same way for the network threads.
- Request Queue Size grows when requests arrive faster than the handlers can take them.
If idle percentages fall while bytes in stay flat, the cluster is doing more work to move the same data. That’s often the easiest way to show another team that their producer settings matter.
Broker latency or client latency?
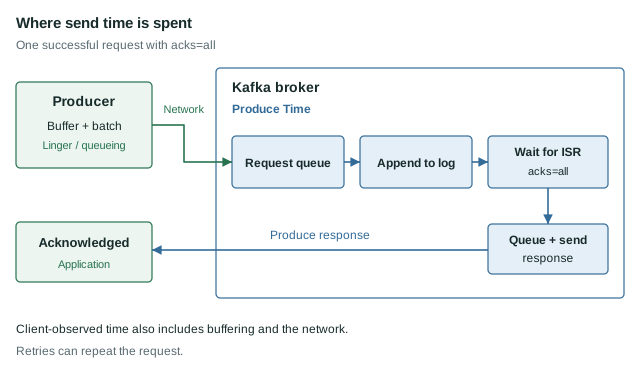
When a team reports slow sends, the first question is whether the time goes on the broker or the client. The Produce Time panel on the Kafka Requests dashboard shows how long the broker takes to handle a produce request at the chosen percentile. That includes waiting for replicas when the producer uses acks=all. Producer Purgatory Size on the Kafka Performance dashboard shows how many produce requests are waiting for those replicas.
- Produce time is low but the application reports slow sends: the time goes on the client side, in linger time, a full send buffer, retries, or the network.
- Produce time is high and purgatory is large: requests are waiting for replication. Look at follower fetch time and the replication dashboards before changing any producer settings.
- Produce time is high and purgatory is small: the broker itself is slow to handle the request. Look at request queue time, handler idle percentage, and disk.
Consumers
How many consumers does a group need?
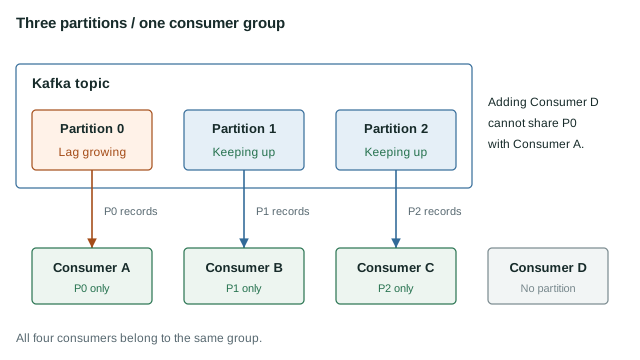
Each partition is consumed by one member of a group at a time. A group can’t usefully have more members than its topics have partitions, and it needs enough members to keep up with the rate records are produced.
The Consumers page lists every group with its State, Members, total Lag and a Catch-Up estimate. Opening a group shows how many Members it has, its Assigned Topics and Assigned Partitions, and a table for each member listing the partitions it owns with their committed offset, high water mark and lag.
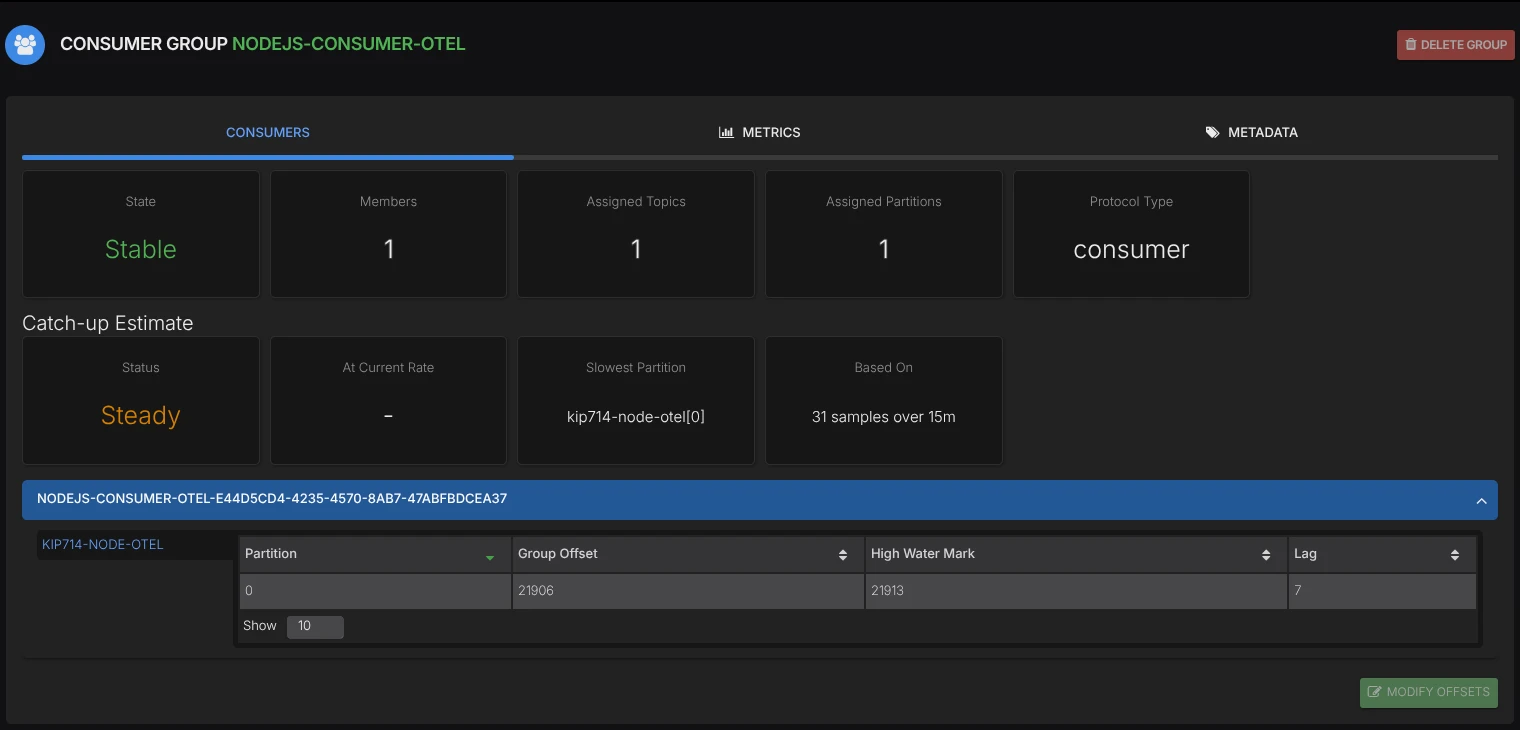
Three things to look for on that page:
- More members than partitions. The extra members sit idle. Adding more won’t increase throughput; the topic needs more partitions.
- Uneven assignments. One member holding far more partitions than the others is doing far more of the work. Check the partition assignment strategy.
- Lag concentrated on one member’s partitions. That member, or the host it runs on, is slower than the rest.
Is the group catching up?
The Catch-Up estimate answers the question lag alone can’t: is this group getting ahead of its backlog, keeping pace, or falling behind?
AxonOps tracks each partition’s lag over a recent window, 15 minutes by default, and reports whether the group is Caught up, draining (shown as a time to catch up, such as ~12m), Steady or Falling behind. The group’s page also names the Slowest Partition, the one holding the group back. Introducing catch-up estimates explains each status and how the estimate is calculated.
The status tells you what to do:
- Falling behind with lag on every partition: the group lacks throughput. Add consumers, up to the partition count, or make each consumer faster.
- Falling behind or slow to drain, with lag concentrated on one partition: usually a hot key or an uneven assignment. More consumers won’t help, because one partition can only be read by one member.
- Steady with a large backlog: the group has little or no spare capacity. Even if it’s slowly draining, any increase in traffic will turn it into falling behind.
For sizing, combine the lag trend with the produce rate from Messages In Per Topic on the Kafka Topics dashboard. While a group is draining, it consumes at the produce rate plus the rate lag is falling. Divide that by the number of members to get what one consumer handles, then size the group for peak produce rate with some headroom. The consumer lag post goes through the per-partition arithmetic in more detail.
Are consumers fetching efficiently?
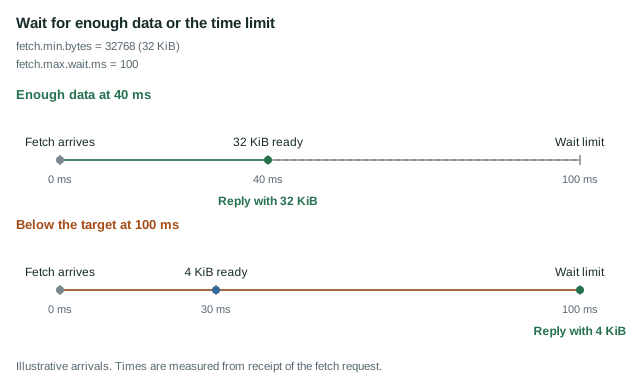
Consumers fetch data in requests too, and fetch.min.bytes and fetch.max.wait.ms control how full each response is. With fetch.min.bytes at its default of 1, the broker answers as soon as there is any data. On a busy topic that can mean a stream of very small fetches.
Compare Fetch Request Per Sec on the Kafka Requests dashboard with Bytes Out Per Broker on the Kafka Performance dashboard. Both count consumer traffic only. A high fetch rate with little data per fetch means consumers are asking too often. Raising fetch.min.bytes, and letting fetch.max.wait.ms cover the wait, cuts the request rate at the cost of a little latency.
Read Fetch Time with care. A fetch that waits for fetch.max.wait.ms because no new data has arrived shows up as a slow fetch, and Fetch Purgatory Size counts those waiting fetches. On a quiet topic high fetch time is normal; it isn’t a broker problem. Fetch Time and Fetch Purgatory Size also include follower fetches from other brokers, so compare them with FetchFollower Time.
The consumer configuration reference covers the fetch settings.
Are groups rebalancing too often?
Every rebalance pauses consumption for the group, and frequent rebalances look like lag that never clears. On the Kafka Overview dashboard, the Group Coordinator row shows how many groups are in each state. A steady stream of groups in PreparingRebalance or CompletingRebalance means members keep leaving and rejoining.
The usual causes are client-side:
- Processing a poll takes longer than
max.poll.interval.ms, so the consumer is removed from the group. session.timeout.msis too short for the environment, so garbage collection pauses or network blips look like failed members.- Pods restart or scale up and down often. Static membership (
group.instance.id) lets a restarted member rejoin without a full rebalance.
The rebalancing guide and consumer groups guide explain the timeouts and assignment strategies involved.
Problems that affect every client
Connection churn
Kafka clients are designed to keep a few long-lived connections open. An application that creates a new producer or consumer for each message, or a service that keeps crashing and restarting, opens and closes connections all the time. Every new connection costs the broker a TLS handshake, authentication and a metadata request.
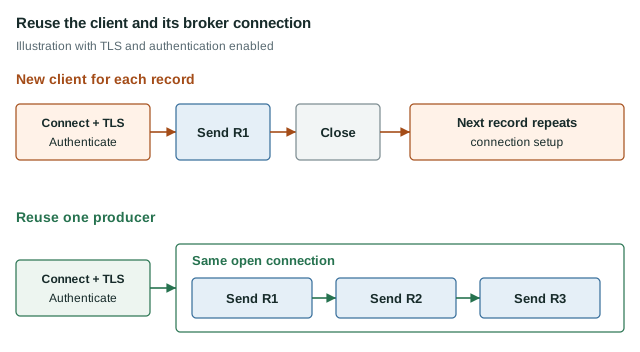
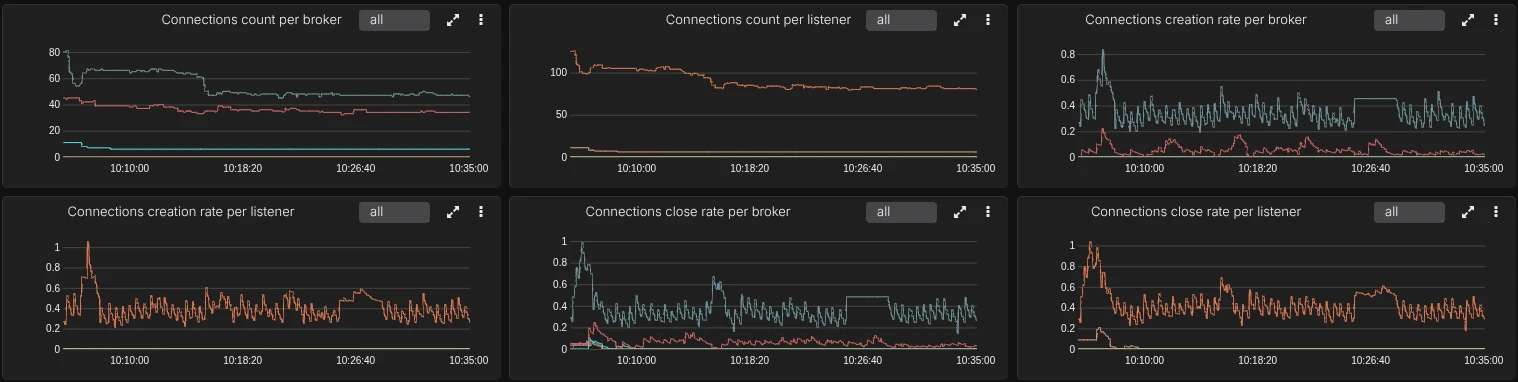
The Kafka Connections dashboard shows Connections creation rate and Connections close rate, per broker and per listener. On a healthy cluster both stay low and flat, with spikes during deployments. A constant high creation rate with a flat connection count means clients connect, do a little work and disconnect. The Metadata Request Per Sec panel on the Kafka Requests dashboard usually rises at the same time. The connection pooling guide covers how clients should manage connections.
Outdated client libraries
The Client Libraries row on the Kafka Connections dashboard lists the client library and version behind each connection. Old clients miss performance fixes, and very old ones can force the broker to convert message formats. The Message Conversion panels on the Kafka Requests dashboard show whether that’s happening. A non-zero conversion rate costs broker CPU and memory, and the fix is to upgrade the client.
Putting a name to the client
The dashboards above show that something is wrong, per broker or per topic. To find which application is responsible, you need per-client figures.
The Kafka Clients dashboard shows the produce and fetch byte rate for each client ID, the number of active producers and consumers, and the number of throttled requests waiting on each broker. Kafka only records these per-client figures when client quotas are in use. You can view and set quotas from the Quotas page under Access Control in AxonOps.
Sort by byte rate to find the clients generating most of the traffic, then check whether their request rates on the other dashboards match what you’d expect. The throttling panel shows when quotas are actively slowing clients down. That’s worth knowing before anyone starts tuning a client that is being throttled deliberately. The quotas guide and throttling guide explain how Kafka applies quotas.
This only works if applications set a meaningful client.id. A cluster full of producer-1 clients is hard to act on, so ask teams to name their clients after the service.
Where to start
If you only have a few minutes:
- Work out records per produce request on the busiest topics. Anything close to 1 is the quickest win.
- Sort the Consumers page by Catch-Up and look at every group that is falling behind or steady with a large backlog.
- Check the connection creation rate. A constant high rate points to a client creating connections it should be reusing.
- Look at the client library versions and the message conversion rate.
For the dashboards used in this post and the metrics behind each panel, see the AxonOps Requests, Performance, Topics, Connections, Overview and Consumer Groups dashboard references, and the Consumers page guide.