

Kafka brokers can be perfectly healthy while the applications reading from them are not. A consumer can crash and leave its group empty, or a deployment can halve its throughput. A hot key can also pile records onto one partition. In each case the brokers keep accepting writes and the cluster dashboards stay green, while the data that downstream services depend on gets older.
In AxonOps, each of those problems shows up in the console and can raise an alert. The alert can go to the team that owns the consumer, not to whoever happens to be on call for Kafka. This post walks through the pieces:
- live lag charts for every group, topic and partition
- the Consumers page, with group state, last activity, lag and a lag trend for every group
- alerts when a group is falling behind or will take too long to catch up
- alerts when a group goes Empty or Dead
- per-group overrides and alert routing, so each team hears about its own consumers
The screenshots come from an AxonOps lab cluster running Go, Java and Node.js consumers.
Watching lag live
The Consumer Groups dashboard (under Dashboard) charts Consumer Group Lag for every group, topic and partition on the cluster. The GroupID and Topic filters at the top narrow the chart to the consumers you’re investigating. The time range control can follow live data or go back to the window when a problem started.
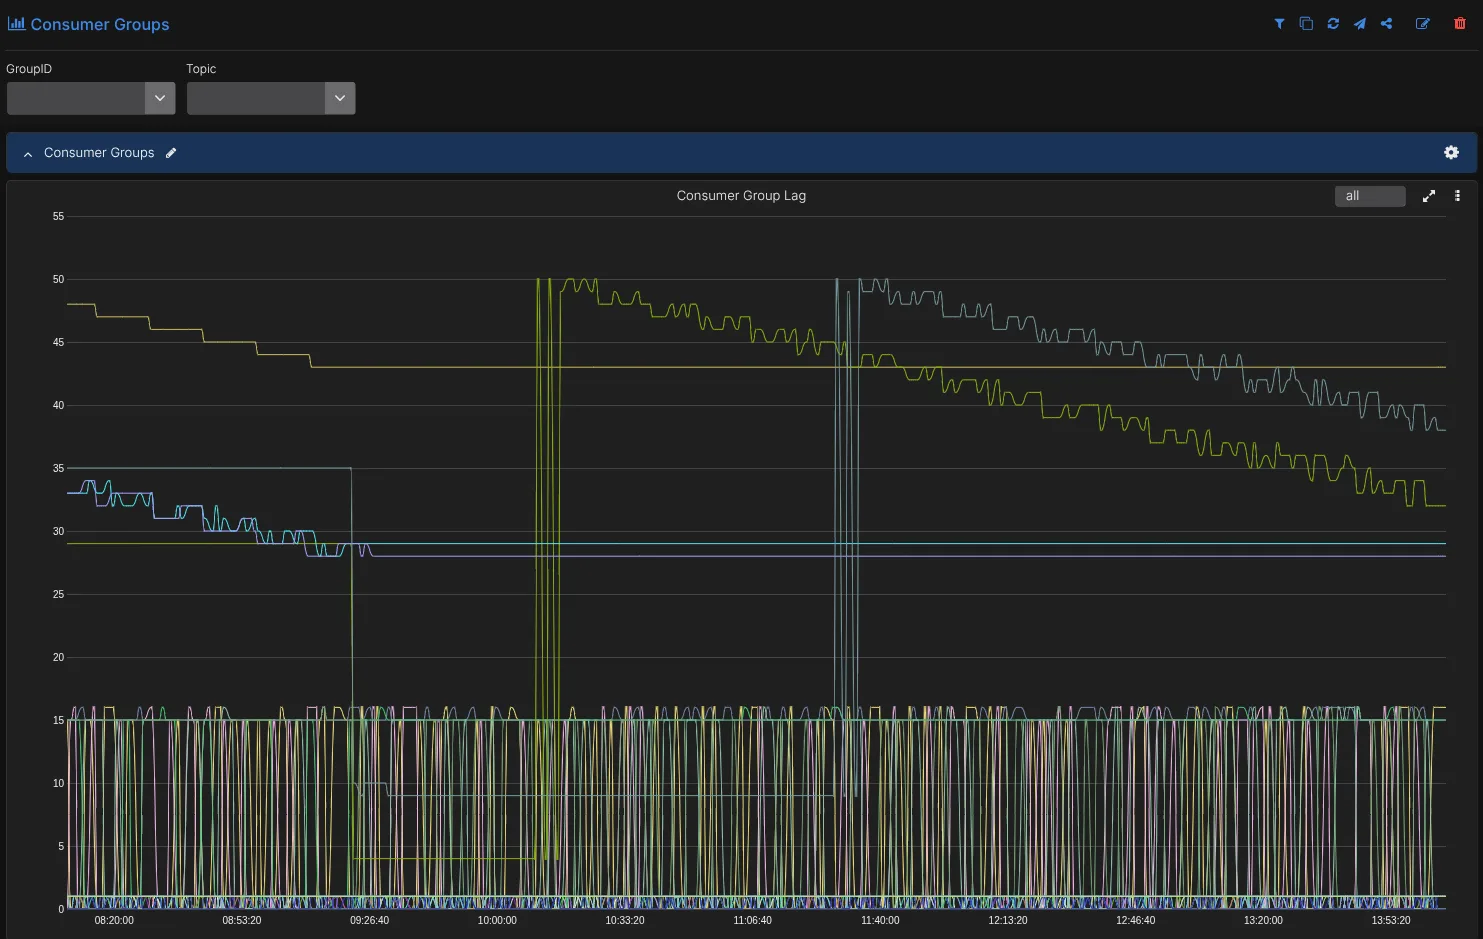
Every consumer group also has a Metrics tab with the same chart, already filtered to that group and broken down by topic and partition. That’s usually the quickest way to tell whether lag is building on one partition or across all of them.
The lag metric is collected by one broker’s AxonOps agent per cluster, so consumer applications don’t need instrumenting to appear here. Two related dashboards cover the client side of the brokers:
- Kafka Clients charts Active Producers, Active Consumers, Produce Byte Rate and Fetch Byte Rate. It has per-client byte rates for clients that have a Kafka quota.
- Kafka Connections shows connection counts and creation and close rates per broker and listener. It also breaks connections down by Client Library and client version, which helps you find applications still using old client libraries.
The Consumers page
Charts are good for investigating one group. To see all of them at once, open Topics & Consumers → Consumers.
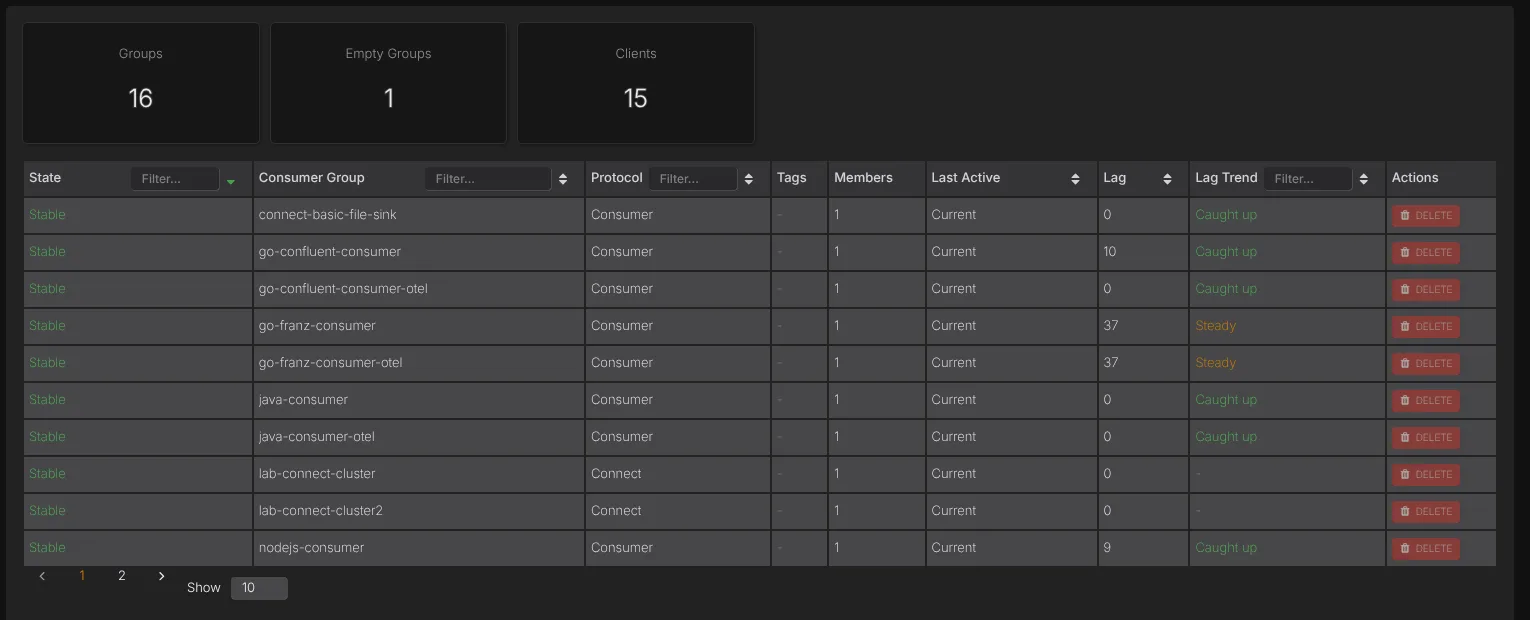
The three tiles at the top give the number of Groups, how many are Empty Groups with no active members, and the total number of Clients across all groups. The table has a row per group:
| Column | What it tells you |
|---|---|
| State | The group’s state as reported by Kafka: Stable, Empty, PreparingRebalance, Dead and so on. By default the table is sorted by state, so Dead, rebalancing and Empty groups come before Stable ones. |
| Protocol | Whether the group is a normal Consumer group, a Connect worker group or Schema Registry. |
| Tags | Metadata tags you’ve added to the group, for example its owning team. |
| Members | How many consumers are currently in the group. |
| Last Active | Current for a group that’s active now. Otherwise, the last time AxonOps saw it in a state other than Empty or Dead. |
| Lag | Total lag across all of the group’s partitions. |
| Lag Trend | Whether that lag is clearing, holding or growing (see below). |
The column filters make a long list manageable. You can filter State to Empty to see every group with nobody consuming, or filter Lag Trend to Falling behind. On a cluster with hundreds of groups, either one gives you a short list to check.
Opening a group shows its members, the topics and partitions assigned to each one, and each partition’s Group Offset, High Water Mark and Lag. This is where you find out which consumer instance owns the partition that’s behind.
Lag trend: is the group catching up?
A lag of 50,000 records tells you nothing on its own. The group might be clearing a backlog after a restart, keeping pace without making progress, or falling further behind every minute. The Lag Trend column tells you which. Each group gets one of these statuses:
| Status | Meaning |
|---|---|
| Caught up | Effectively no lag left. |
| A time such as ~12m | Lag is falling. This is how long the slowest partition will take to reach zero at the current rate. |
| Steady | Lag is neither meaningfully rising nor falling. The group keeps up with producers but doesn’t clear its backlog, or clears it too slowly to project a time. |
| Falling behind | Lag is rising. At the current rate the group never catches up. |
| Recalculating | Not enough recent samples yet, for example just after a restart. |
AxonOps samples each partition’s lag about every 30 seconds and judges the trend over the last 15 minutes. The trend has to hold consistently across that window and be larger than the partition’s normal noise. A single spike from a batch of commits isn’t enough to mark a group as falling behind. A group is only draining when every partition with a backlog is draining, and the projected time comes from the slowest one.
Opening a group shows the same estimate in its Lag Trend panel, with the partition that’s setting the pace:
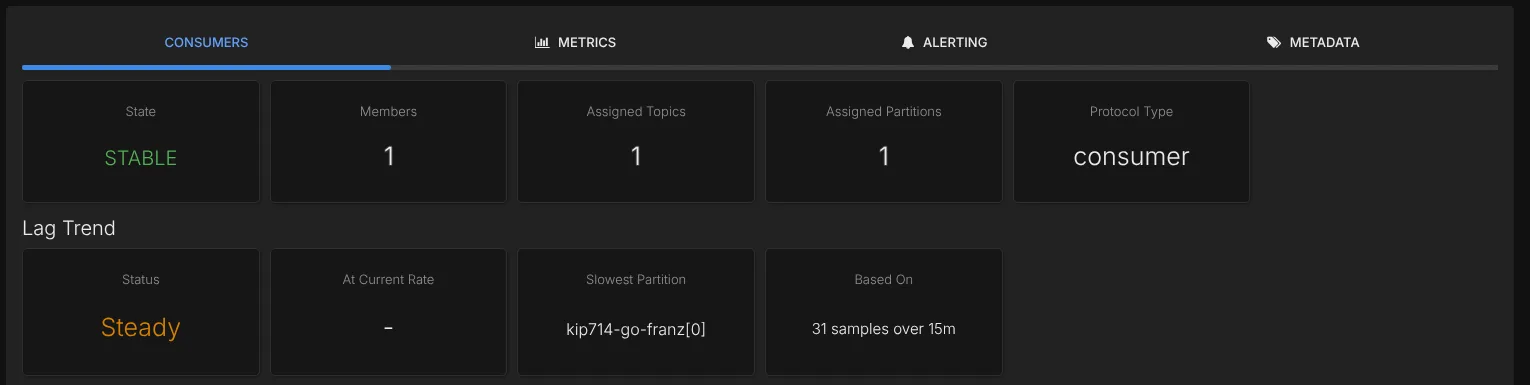
Slowest Partition is often the most useful field. If one partition is falling behind while the others are fine, adding consumers won’t help. Only one member reads each partition, so the fix is in the keys being written to it or the consumer that owns it. If every partition is falling behind, the group needs more throughput. Our guide to Kafka consumer lag goes through both cases in detail.
Empty groups, Kafka Connect worker groups and Schema Registry groups don’t get a trend. An empty group has nothing consuming, so there’s no rate to project; its Lag column still shows the backlog. Connect workers and Schema Registry use groups to coordinate, not to consume partitions. Sink connectors run their own consumer groups, and those do get a trend.
Alerting on the lag trend
To be told when a group is in trouble, configure the Consumer Group Monitor card under Settings → Kafka for the cluster.
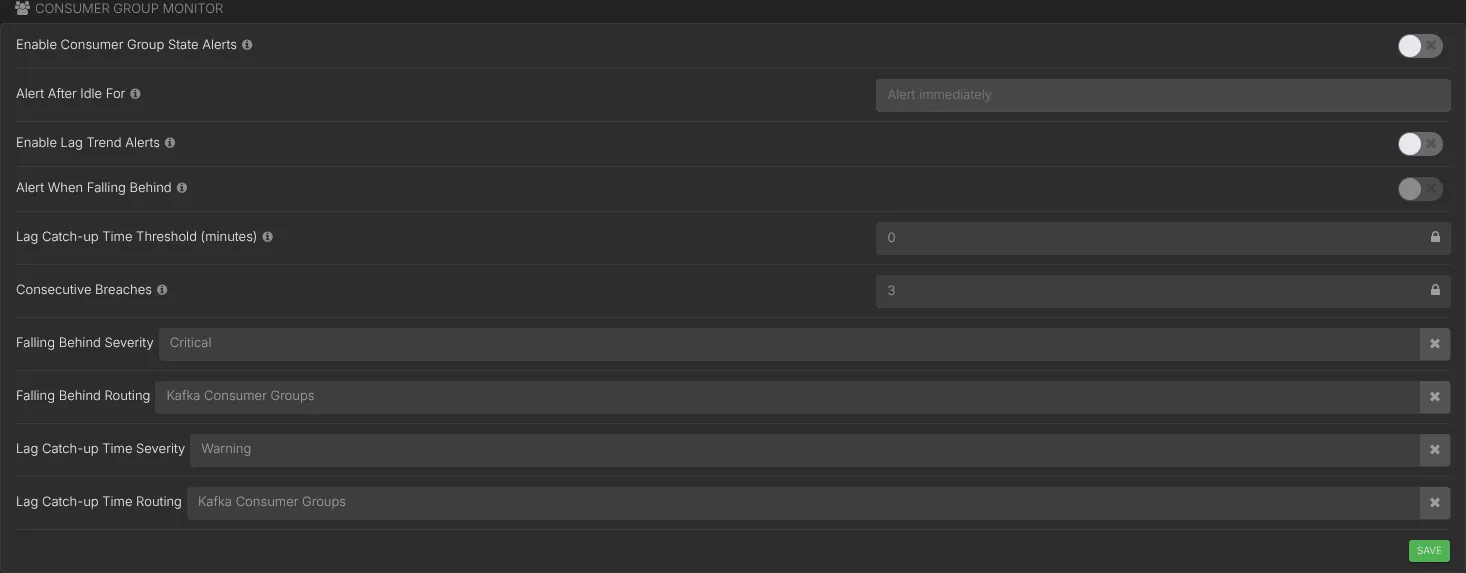
The lag trend settings are:
- Enable Lag Trend Alerts turns lag trend alerting on for the cluster. It is the master switch, so individual groups can only change lag alerting while it’s on.
- Alert When Falling Behind raises an alert when a group’s lag keeps rising. The alert names the partition responsible.
- Lag Catch-up Time Threshold (minutes) raises an alert when a draining group’s projected catch-up time is longer than this. Zero turns it off. The maximum is 59 minutes, because the estimator won’t project further ahead than that. A slower drain is reported as Steady, which the falling behind alert handles better.
- Consecutive Breaches is how many checks in a row (about 30 seconds apart) must breach before an alert fires. The default is 3. Falling behind and catch-up time breaches are counted separately, so the group has to keep breaching for the same reason.
Each alert type has its own Severity and Routing. By default, falling behind alerts are Critical and catch-up time alerts are Warning. Both go to the Kafka Consumer Groups routing, which every Kafka cluster has. You choose that routing’s integrations on the cluster’s Alert Routing page; with no integrations set, it falls back to the cluster’s Global routing. That keeps consumer lag alerts away from broker alerts if you want them separate.
Alerting when a group goes empty
Lag alerts cover groups that are consuming too slowly. They can’t cover groups that have stopped consuming, because an empty group has no rate to measure. When every consumer in a group crashes or is scaled to zero, Kafka marks the group Empty. Its committed offsets stay where they were while producers keep writing.
Enable Consumer Group State Alerts in the same card raises a warning alert when a group becomes Empty or Dead. The alert text is consumer group <group> is Empty, and the alert resolves on its own once the group has active members again.
Some groups are meant to sit idle between runs, such as a nightly batch job or a consumer that’s only started during a recovery. Alert After Idle For sets how long a group may stay without consumers before it’s alerted on, as a duration such as 15m or 1h30m. Leave it empty to alert as soon as a group is seen idle. With a delay set, the alert reads consumer group <group> has been Empty for more than 15m.
Per-group overrides
One set of thresholds rarely suits every group. Five minutes of lag is an incident for a payments consumer, but a reporting job can be an hour behind without anyone caring. Each group therefore has its own alerting settings.
The group’s Alerting tab overrides the lag trend settings:
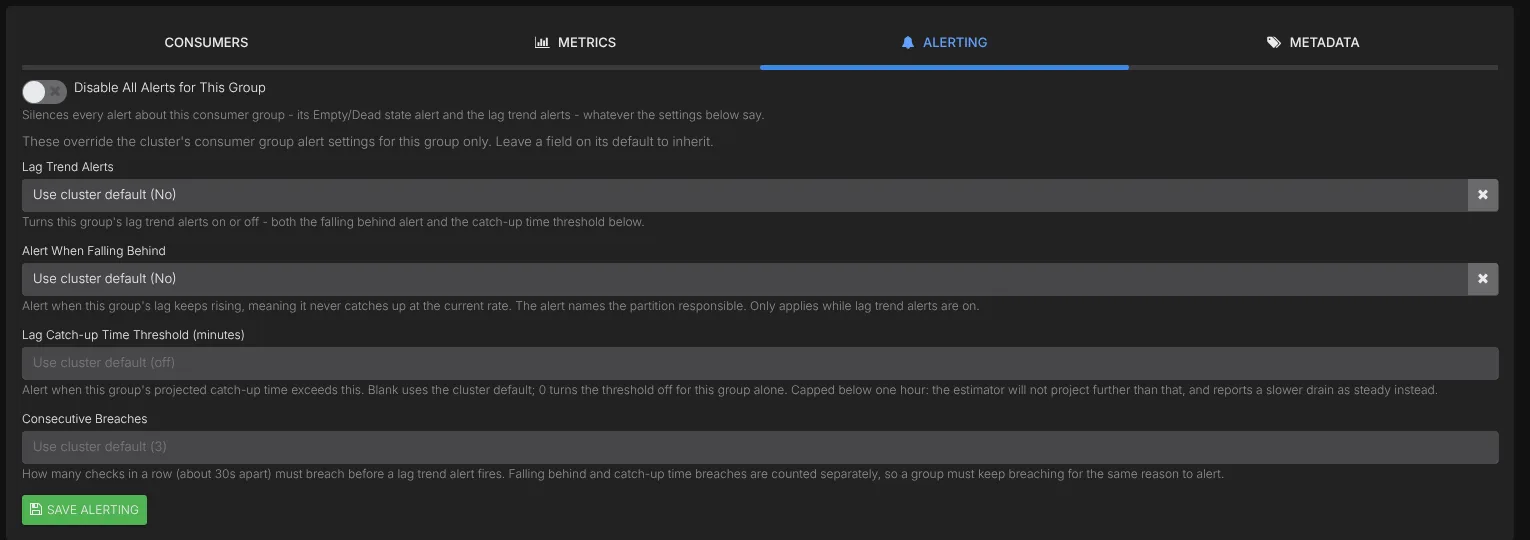
- Disable All Alerts for This Group silences every alert about the group, both state and lag, whatever else is set.
- Lag Trend Alerts and Alert When Falling Behind can each be Yes, No or Use cluster default.
- Lag Catch-up Time Threshold (minutes) sets a threshold for this group only. Blank inherits the cluster value, and 0 turns the threshold off for this group.
- Consecutive Breaches can be raised for a noisy group or lowered for a critical one.
The group’s Metadata tab holds the state alert settings and its routing:
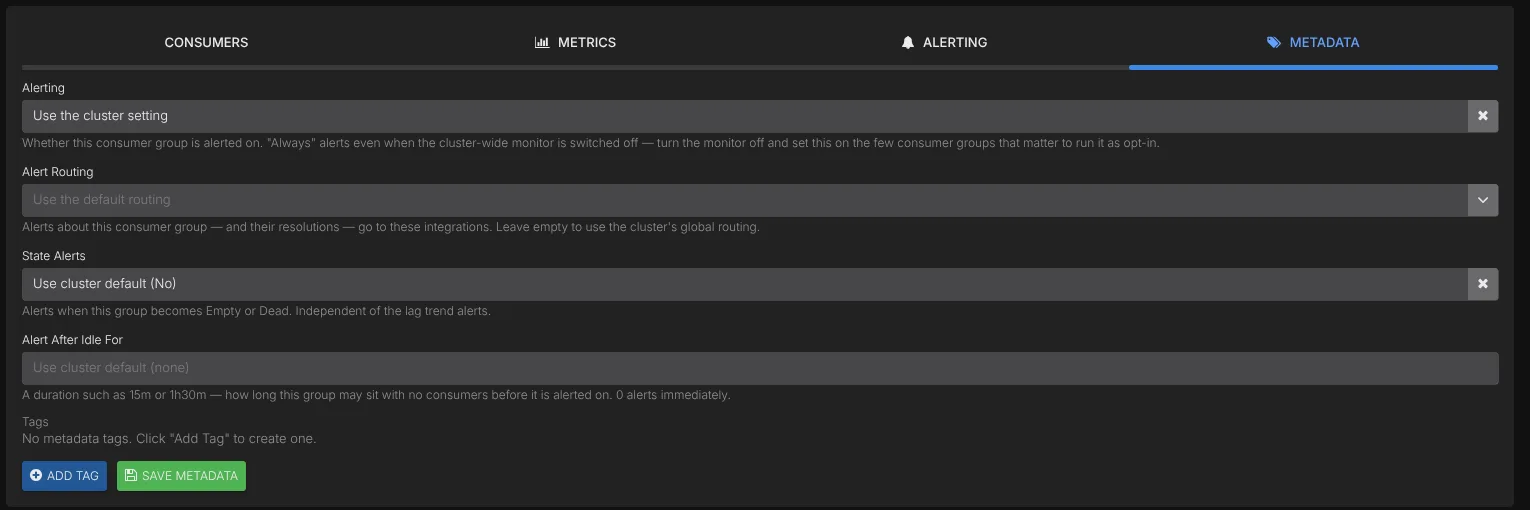
- Alerting can be Use the cluster setting, Always alert or Never alert. Always alert works even when the cluster monitor is off, so you can run empty-group alerting as opt-in. Leave the monitor off and switch it on for the few groups that matter.
- State Alerts turns the Empty/Dead alert on or off for this group, independently of its lag alerts.
- Alert After Idle For sets this group’s own grace period.
0alerts immediately even if the cluster has a delay. - Alert Routing sends this group’s alerts to specific integrations (next section).
- Tags are free-form key/value pairs that appear in the Tags column on the Consumers page, such as
team=payments.
Routing alerts to the team that owns the consumer
AxonOps can send alerts to Microsoft Teams and Slack as well as PagerDuty and ServiceNow through its notification integrations. You can create as many alerting endpoints as you need under Settings → Integrations with separate entries for each team’s channels and services.




Under Settings → Alert Routing you can assign alert types and severities to different endpoints. Critical broker alerts could reach the Kafka SRE team’s PagerDuty service while warnings go to its Teams channel. A consumer group’s state alerts can go directly to its owning team’s endpoints using the group settings below.
Kafka is usually run by a platform team, but the consumers belong to the application teams. Sending every empty-group alert to the platform team means someone has to work out who owns invoice-reconciler before the right people can start fixing it.
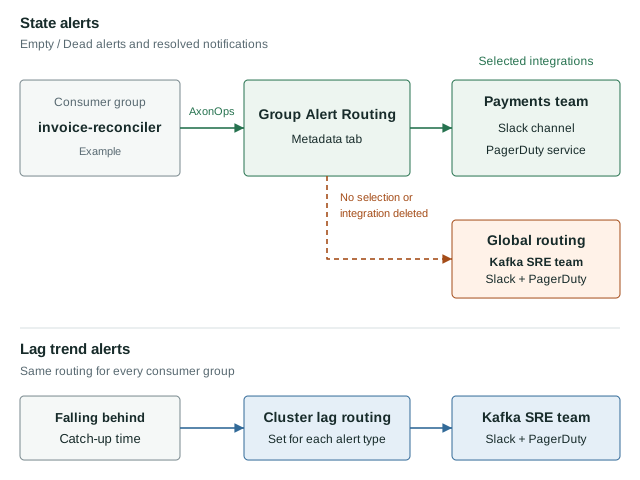
The Alert Routing field on a group’s Metadata tab lists the notification endpoints configured for the cluster. Select the payments team’s Slack channel and PagerDuty service to send that group’s state alerts and resolved notifications directly to that team. If you leave the field empty, the group uses the Global routing. If a selected integration is later deleted, AxonOps falls back to the Global routing so the alert isn’t silently dropped.
Lag trend alerts are routed per cluster, through the Falling Behind Routing and Lag Catch-up Time Routing settings described above. Every group’s falling-behind alerts go to the same routing, whatever group-level overrides are set.
Getting started
The Consumers page, the lag trend and the lag dashboards need no setup beyond the AxonOps agent on your brokers. Alerting is off by default, so a reasonable first configuration is:
- In Settings → Kafka → Consumer Group Monitor, turn on Enable Lag Trend Alerts and Alert When Falling Behind. Leave the catch-up time threshold at 0 for now.
- Configure integrations for the Kafka Consumer Groups routing on the cluster’s Alert Routing page, so lag alerts reach the people who look after consumers.
- Turn on Enable Consumer Group State Alerts with a short Alert After Idle For, such as
5m, so routine restarts don’t page anyone. - For each important consumer group, set Alert Routing on its Metadata tab to the owning team’s integrations and add a tag naming the team.
- Set a Lag Catch-up Time Threshold only on the groups where freshness really matters, from each group’s Alerting tab.
- Switch alerts off for scratch groups and other consumers that are expected to sit idle.
For more detail, see the Consumers documentation, the Consumer Group Monitor reference and the integrations guide. To find out why a group has fallen behind, our Kafka consumer lag guide and Kafka metrics guide cover the next steps.